| Wyvern Semiconductors | Expert in Digital IP Solutions |
|
Design Program for Windows™ by Simon Southwell 28th July 2002 Contents
1 IntroductionIn digital signal processing a type of finite impulse response (FIR) filter is often used called a windowed-sinc filter. These have the advantage of having great frequency response, being incredibly stable and very linear, but at the expense of computational time and poorer time-domain performance, such as pass band ripple and step response overshoot. None-the-less, their use is common in such fields as digital audio. The WinFilter program was originally an exercise in exploring such filter techniques and also for learning basic windows programming. The first program was command line based (called filter), and then programmed for UNIX based X11 windows (and called xfilter). It was then ported to the Win32 environment, for more general accessability. For the more ambitious and those that want to know more, the source code can be downloaded from github, which has included a pre-compiled windows executable. It is set up for a Visual C++ environment, but should be easily converted to, say, a 'make' based compilation. The source code is released under the GNU general public license, a copy of which is included in the source bundle. WinFilter's main aim is to allow exploration of windowing techniques and the effects on performance of such considerations as quantisation, number of taps (related to computational time) and parameters of certain window functions. However, it can be used to design a filter with arbitrary attenuation and transition frequency (limited by the other considerations), using an 'automode'. The theory behind windowed-sinc filters is not documented here, but I thoroughly recommend [1], and for digital audio specifics refer to [2]. Use of FIR filter in audio is covered in [3] (see appendix B) As well as producing a set of filter tap values that may be used to implement a real filter, the program can plot frequency, phase and impulse responses in graphical form, and display a graph of the window function if so desired. By default WinFilter designs a lowpass filter, but bandpass filters may be specified and spectral inversion and reversal are implemented for designing highpass and bandstop filters. It can't yet be used to design a filter with an arbitrary response—watch this space. Figure 1 below shows the single default window of WinFilter. It is set up to specify a 4 times oversampling DAT frequency (4×48KHz = 192KHz), 120 tap, Fc=20KHz lowpass filter using a Hamming window with an alpha coefficient of 0.23 and double precision floating point quantisation. It will display a graphical frequency response in dBs and place the coefficients of the response in a file called filter.dat when executed. So let's fill in some details about this and other aspects of WinFilter in the following sections. 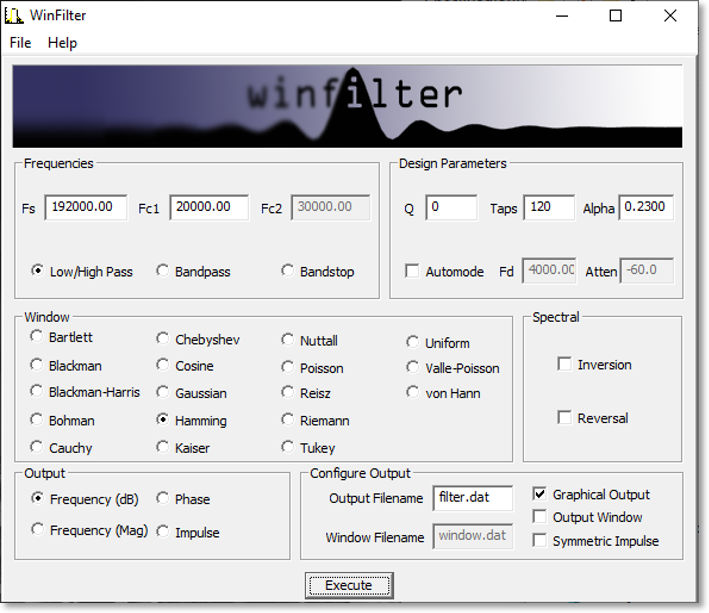 Figure 1: Default window 2 Specifying the FilterThe primary purpose of WinFilter is to explore simple windowed-sinc filter design and allow the experimentation of the various factors which modify the filters response. To this end there are many variable and selections available in the main window with which to experiment, and then monitor the effects. They are gathered into various groups of related items, as marked by a labelled border, and we will look at each of these groups in turn. 2.1 Filter Type and FrequenciesThe diagram below highlights the 'Frequencies' group, which determines the main characteristics of the filter.  Figure 2: Frequencies Box The type of filter produced is determined by the three radio buttons at the bottom of the box. The choices are Low/High pass, Bandpass and Bandstop. The low- and highpass filters are lumped together because we design a highpass filter by simply defining a lowpass filter and inverting it (more of this in section 2.4). When in low/high pass mode, we must specify two frequencies (in Kilohertz). The first frequency, Fs, is the sampling frequency. In the default WinFilter state this is 192KHz, which is 4 times the DAT sampling rate of 48KHz. The second frequency specified is the cut-off frequency, Fc1. This determines the -3dB point of the filter; i.e. where it is deemed to have transitioned from the pass band to the stop band (or vice versa). This must be below the Nyquist frequency (Fs ÷ 2), and usually some way below this frequency to be a useful filter. When either bandpass or bandstop are selected a third frequency is required. This is Fc2, and determines a second -3dB point, where the filter will transition back to the stopband (for a bandpass filter), or the passband (for a stopband filter). This frequency must be greater than Fc1. The basic filter is now specified; its type, the sampling rate and the cut-off points. As we are designing a windowed-sinc filter, we must now choose a suitable window. 2.2 Window FunctionAs DSP texts will tell you, ideally we should have a infinite number of samples for our filter in order to get an infinitely steep transition between the pass and stop bands. Because this is impractical, we must limit the number of samples we use to some finite value, limited by the compute speed against the sample rate. However, simply truncating the samples produces very poor results, and the situation can be improved by the use of 'windows', which trauncate the samples of the filter's impulse response more smoothly. The windows usually have a bell shape structure in order to achieve this. WinFilter has many window functions to choose from. Figure 3 highlights the position of the 'Window' group on tha main window. Each of these window functions has different characteristics and are of varying degrees in quality and performance. Many perform poorly indeed. The Bartlett window is a simple triangular function (we will see how to display the window shapes graphically later), and is only a marginally better choice than the 'uniform' window, which is effectively a 'do nothing' option. However, many different windows are included in WinFilter so that their relative effects and merits may be explored. Some of the windows that can be selected also require a parameter (usually refered to as Alpha or α) which alters the windows shape to trade off filter characteristics, such as stopband attenuation versus transition frequency (the frequency range from Fc to achieved attenuation). In WinFilter this is specified in the Design Parameters box (see section 2.3). The following window functions do not have a parameter: Bartlett, Blackman, Blackman-Harris, Boham, Nuttall, Reisz, Riemann, Uniform, Valle-Poisson and von Hann. For the other functions that do, a sensible default will be selected upon selection of the window function, and this may be subsequently altered, if desired. The valid range for Alpha depend on the window, but an error message is displayed if the value strays out of bounds. (See appendix A for list of valid values.) 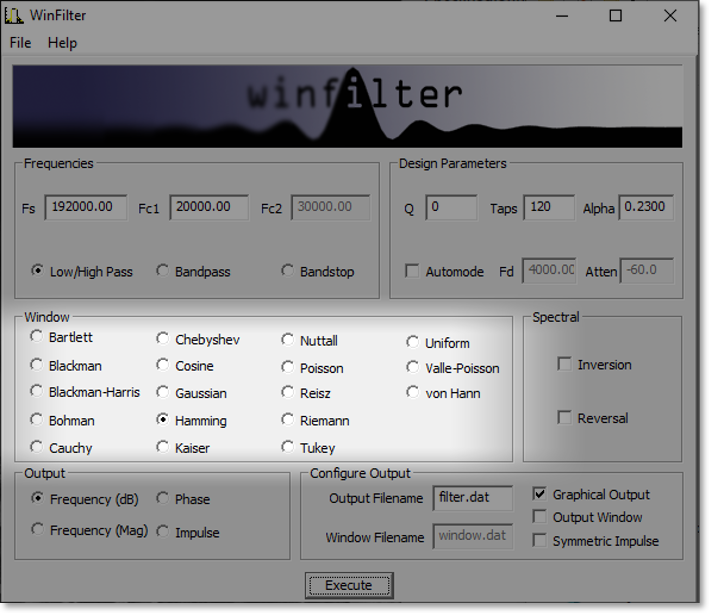 Figure 3: Window Box 2.3 Design Parameters (Manual)Having specified the filter's type and frequencies, as well as the window function we will use, there are some last parameters we must specify which have an effect on the filter's performance. The Design Parameters group collects these variables together. Figure 4 highlights where this is on the main WinFilter window. The group is separated in to two rows. The first row is for manual specification of the design parameters, which we shall deal with in this section. The second row is for automode which is covered in the next section. The left most box in the top row, Q, specifies the number of bits used for each sample. This parameter sets a limit on the achievable attenuation, as the quantisation of the samples introduces noise which falls off at -6.02dBs per bit. So, for example, 16 bit samples give a noise floor at just underr -96dB. The default value of the Q box, however, is 0: this does not mean 0 bits, but selects double precision floating point numbers (64 bits—but not integer). This is the best that can be achieved with this filter program, and is really there to remove the effect of the quantisation (though not entirely) whilst exploring the other factors which affect performance. A practical design is likely to be integer based (though not exclusively), and be between, say, 8 and 32 bits for its samples. But it doesn't have to be. 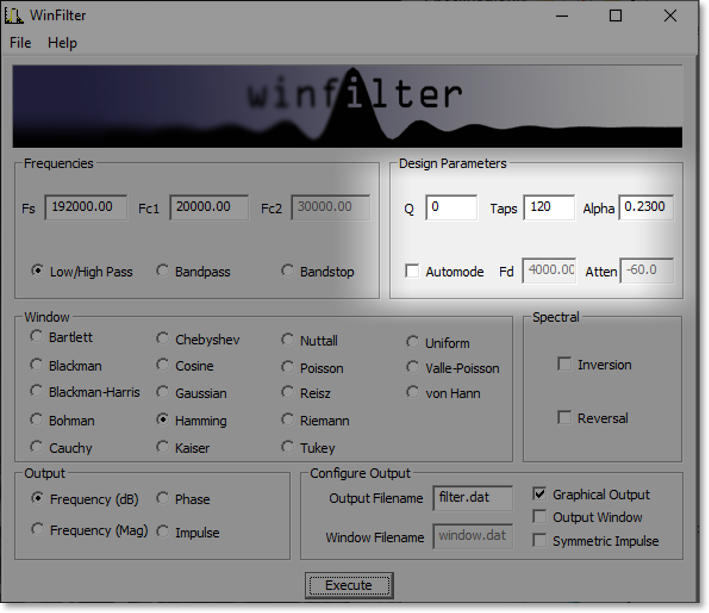 Figure 4: Design Parameters Box The next box, labelled 'Taps', gives the number of sample points that the filter's impulse response will have. In general, the more points (or taps) the better the filter's performance, but the longer the compute time per output point (read a text on convolution for why this is). By default, the Tap box is specified at 120 taps, which is typical for a 4 times oversampling audio filter. Finally, the Alpha box specifies the window function's parameter, should that be required (see section 2.2). 2.4 Automode Design ParametersIn the last section it was explained how to specify the number of taps for the filter, and also the Aplha parameter for the window function if needed. However, WinFilter can choose these for you automatically if you know the attenuation and transition frequency (fD) required in your design. By checking the Automode tick box, the Fd and Atten boxes become active. Also, a Kaiser window is selected, and the Window group made inactive, as automode only works with a Kaiser window. The Fd box gives the frequency range for the transition between pass- and stopbands. So, for the default values of 4KHz and - 60dB, then (given the other values at default) we are specifying that the filter transitions from -3dB at 20KHz to the specified -60dB by 24KHz. Upon execution (see section 4) WinFilter automatically selects the number of taps required, and adjusts the window Alpha for the given Fd and Atten parameters. Though inactive, the Tap and Alpha box values are adjusted so that you may see what values have been selected. The Tap is especially important, as this must be a value that is reasonable for a filter compute time. The Alpha value is just for interest, as this will be 'built in' to the resultant impulse response. The Q box remains active in automode, and you can choose the sample bit size as you wish. However, if the attenuation chosen is less than -6.02 x Q (excepting Q=0), then the limit on attenuation will be Q and not the Atten specification. Thus the default of -60dB requires at least 10 bit sampling, and probably more for a practical solution. 2.5 Spectral Modification
The Spectral group allows the basic filter specification to 'flipped' in the resulting
frequency repsonse. This is either an inversion (flipped vertically) or a reversal
(flipped horizontally). Figure 5 shows the location pf the spectra; box, and the two
tick boxes for spectral Inversion and Reversal.
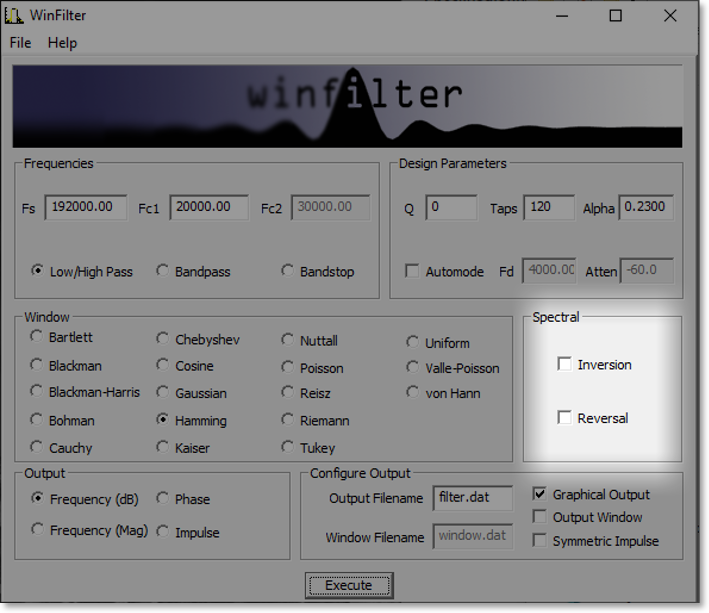 Figure 5: Spectral box The main practical purpose for the spectral features is for specifying a high pass filter when the Low/High Pass tick box is selected in the Frequencies specification (see section 2.1). So, from the default settings, with Fc1 specified at 20KHz, if the 'Inversion' box is ticked, the frequency response will be flipped vertically so that the stop band starts at 0Hz and rises to the -3dB point at the Fc1 frequency. If, on the other hand, the 'Reversal' box is checked (leaving 'Inversion' unchecked) then the frequency response will be flipped horizontally, so that it is reversed, with the pass band coming down from (In the example case) 96KHz, for 20KHz to a -3dB point of 76KHz. Essentially it has been flipped about the 48KHz frequency. It is possible to check both the Inversion and Reversal boxes at the same time for the low/high pass filter mode, though not for the bandpass and bandstop modes, where only reversal is allowed. As stated before it is only really useful to use inversion in low/high pass mode when designing a real filter, but you may experiment with these options to explore the effects; especially on the resultant impulse response. You will have to consult a DSP text to get all the details, but the clue to what is going on is to think about what's happening in the frequency domain, and map it to the time domain. Firstly remember that adding and subtracting in the frequency domain is adding and subtracting in the time domain, but multiplication in the frequency domain maps to convolution in the time domain (and vice versa). So Inversion in the frequency domain is simply subtraction of the filter response from an 'all pass' filter (i.e. one that is unity, or 0dB, for all frequencies. In the time domain a unit impulse is an all pass filter, since convolving a signal with this results in the same signal, so the impulse response is simply subtracted from this; i.e. inverting all the values and then adding 1 to the (inverted) centre tap. For reversal the frequency response is shifted bodily to the Nyquist frequency. This gives the reversed response since the response is symmetrical about 0Hz in the negative frequencies (not normally thought about), which will then sit between 0Hz and the Nyquist frequency. In the frequency domain, shifting the response to another frequency is simply to convolve it with a unit delta at that frequency. Since we're shifting to the Nyquist frequency, which is at half the sampling rate, we simply multiply the impulse response by this unit frequency, and this equates to simply inverting every other sample. 3 Specifying the OutputThe previous section has explained how to completely specify a basic FIR filter, with all the relevant parameters for the design. There are still two steps needed. Firstly, we must verify that the filter specified has the desired response, and secondly we must obtain the impulse response values which would be used to realise the filter. In this section we look at how to obtain graphical and tabular analysis data to check the response characteristics, and how to obtain the filter tap values for building into a design. 3.1 Generated Coefficients TypeThe main output of WinFilter is a file containing a list of data couplets. Depending on the output type selected, these may be time, frequency or phase responses. In the case of a time response, the output contains the list of filter taps which can be used to realise a real filter. Figure 6 shows the location of the group to specify what kind of output is required. 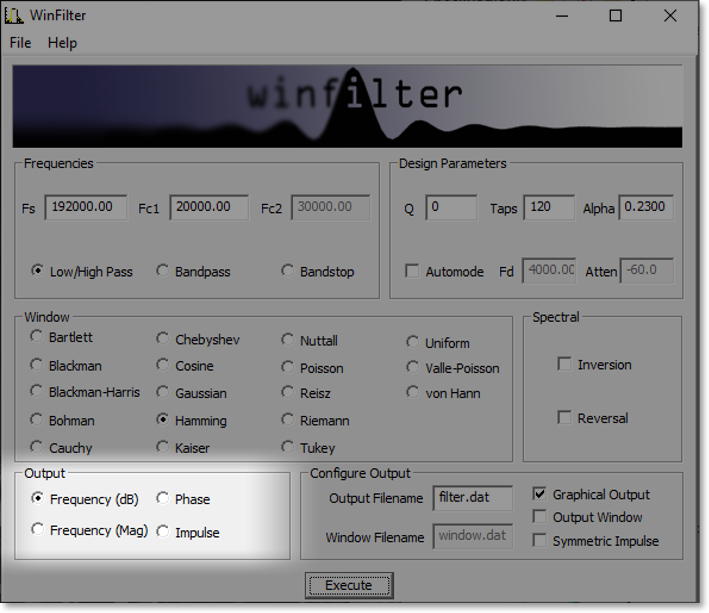 Figure 6: Output Box The process of designing a filter is likely to be one of analysis first, followed by generation of the filter tap values. So analysis of frequency and phase responses will happen in an iterative manner until the desired characteristics are achieved, and then the impulse response generated. In order to decypher the responses, a visualisation will be needed. The output values may also be displayed as a graph by WinFilter to give an overall picture of the response, though the graphing abilities are limited. However, the output data are readily imported to other more sophisticated graphing tools, such as Xgraph, or even an Excel spreadsheet and plotted within there. Control of graphical output is covered in section 3.2. Only the type of output generated is controlled in the Output group. There are four choices for output type. Two of these are for a frequency response. Frequency (dB) gives a classic logarithmic plot of response against (linear) frequency, and is the most useful output for analysis (see Figure 9). If required, a linear-linear frequency plot may be generated by checking Frequency (mag) (see Figure 10). This is less useful generally, but gives an indication of attenuation for filters whose signal isn't necessarily logarithmic in behaviour. The phase response is also of limited use, as all FIR filters of the type we are looking at inherently have linear phase responses. The phase characteristics do sometimes exhibit other behaviours within the stop band, and this information may be of use in some circumstances (see Figure 11). These three outputs are all analysis outputs, and do not directly get involved in a filter implementation. The Impulse check button is used to generate the final filter tap values, be they floating point numbers or bit quantised integers as specified in the Design Parameters. These can be plotted graphically as well. Again, this is of limited use, though the effects of windowing and spectral manipulation may be observed. (See Figure 12) At the end of section 4, examples of the graphical output for each of the output types is shown (Figure 9 to Figure 16). 3.2 Output DestinationSo, having specified what type of output we want, we must specify where to put that output. This is done in the Configure Output group, where destination files are specified and whether a graphical plot is required. Figure 7 shows where on WinFilter's main window the Configure Output group is located. The two left hand boxes specify the output filenames to use for output data, whilst the check boxes on the right enable graphical output.  Figure 7: Configure Output box The normal output (frequency, phase, impulse) will be placed in the file as specified in the Output Filename box. This can be a full hierarchical filename, but more usually a simple filename with no directory specification, in which case it is saved in the directory from which WinFilter was run. If a graph of the output is required then the Graphical Output check box is ticked (the default case), or unchecked if not. In addition to outputting the response data it may be informative to output the window function. To do this, the Output Window check box is ticked. This enables a graphical plot of the window (see Figure 13), and also the saving of window data into a file as specified by the Window Filename box. By default, an impulse output will be in the format of an Xgraph compatible file, suitable for plotting. If the Graphical Output box is checked. An alternative output can be selected by checking the Symmetric Impulse box. This will disable the Graphical Output, and force selection of the Impulse output. With this selected, and with a quantisation Q with a non-zero value, the output will now be in the format of hexadecimal numbers which are suitable for reading in Verilog using $readmemh. In addition, the output will use an extra bit from the Q value and scale the output to have a maximum of 2Q instead of 2Q-1. This allows for a unity gain though the filter at the expense of an extra bit on the tap value. So, for example, for a 12 bit Q value, the range of values is scaled to be between -2048 and 2048, instead of -2048 and 2047, and the output tap values require 13 bits. 4 ExecutionSo (finally), having specified everything possible for the filter, we can generate the results and graphs by hitting the Execute button. The location of the button is highlighted in Figure 8. 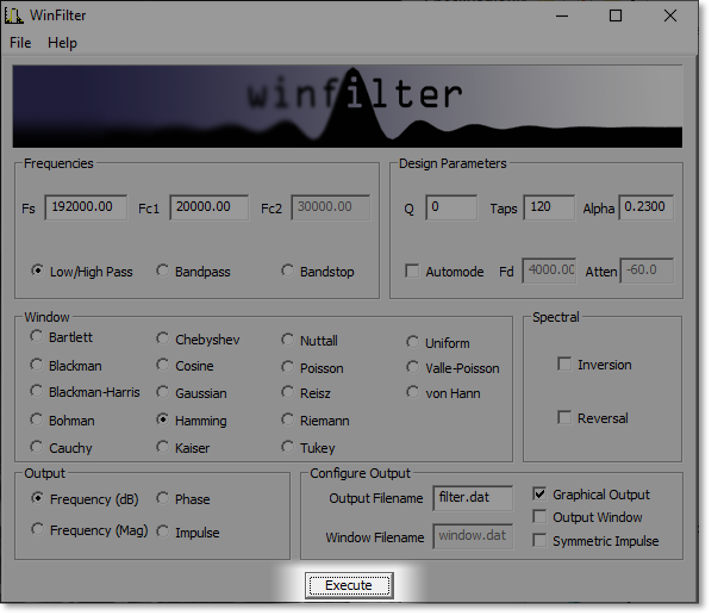 Figure 8: Execute Button Upon execution the output data is generated, and this will overwrite any existing data residing in a file of the same name as the active files specified in the Configure Output group. Graphs will be generated and displayed at this point as well. The Execute button may be activated as many times as desired, which will generate new graphical output (when selected) so that results of specification changes may be compared. And that's it! This is the limit of what WinFilter can do. To close the program, simply select File->Exit from the menu. A set of example outputs follows for reference. I hope the program is useful to you as either an educational tool, or for a real filter design implementation. 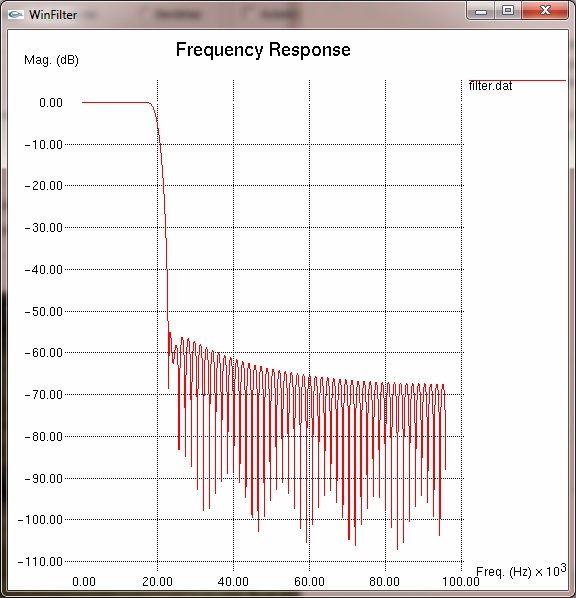 Figure 9: Lowpass Frequency (dB) Response 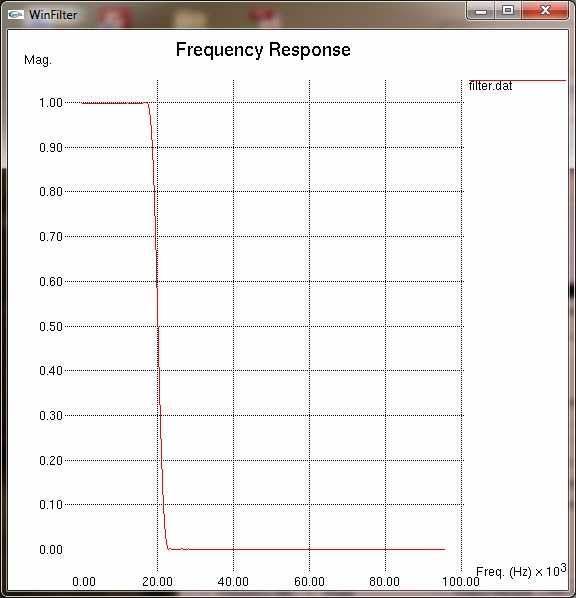 Figure 10: Lowpass Frequency (Mag) Response 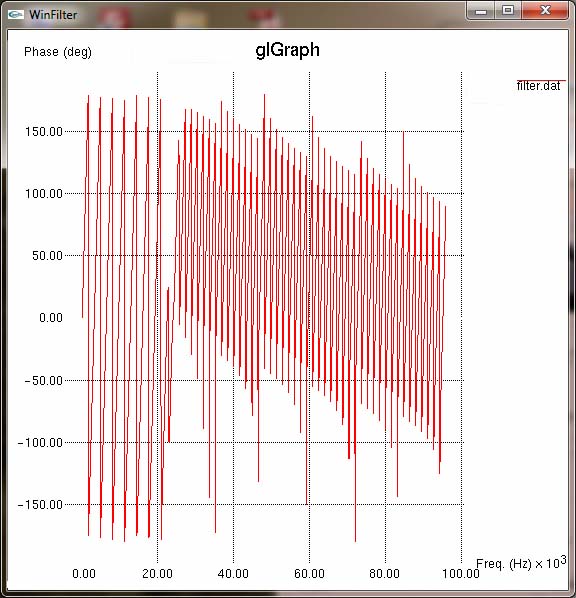 Figure 11: Lowpass Phase Response  Figure 12: Lowpass Impulse Response 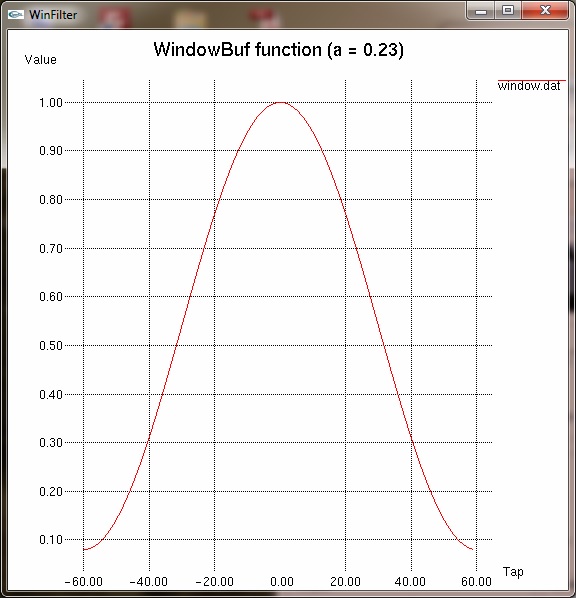 Figure 13: Window Function 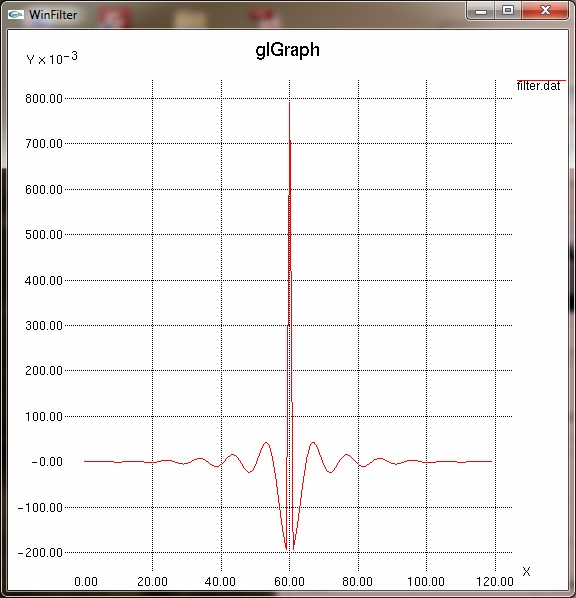 Figure 14: Highpass (Inverted lowpass) Impulse Response 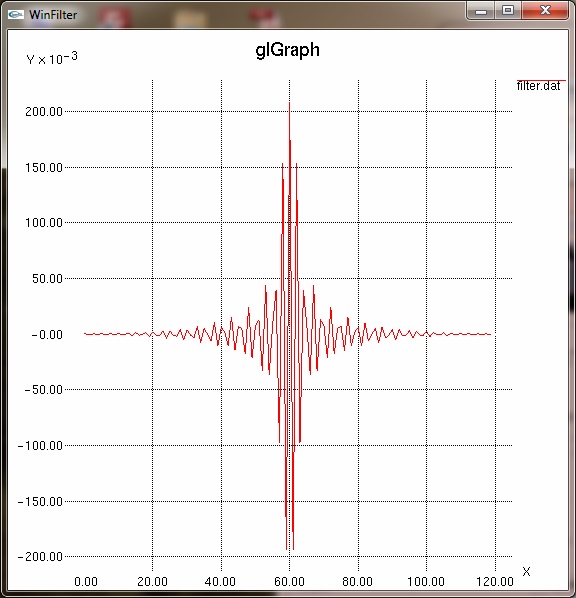 Figure 15: Highpass (Reversed lowpass) Impulse Response  Figure 16: Bandpass Frequency (dB) Response A Window Function SummaryThe following table lists all the supported window functions with information regarding their characteristics and valid settings.
¹ A subjective assessment based on default audio example. Not meant to be definitive. Table 1: Window function summary B ReferencesDSP References (cited)
Programming References (not cited)
© 2002-2014 Simon Southwell Last Updated 22nd April 2014 simon@anita-simulators.org.uk |
